2.1 ЩшМЦБЈБэ
1ЃЉаТНЈОіВпБЈБэЃЌНЋБЈБэПщ report0 ЭЯШыЕН body жаЃЌШчЯТЭМЫљЪОЃК
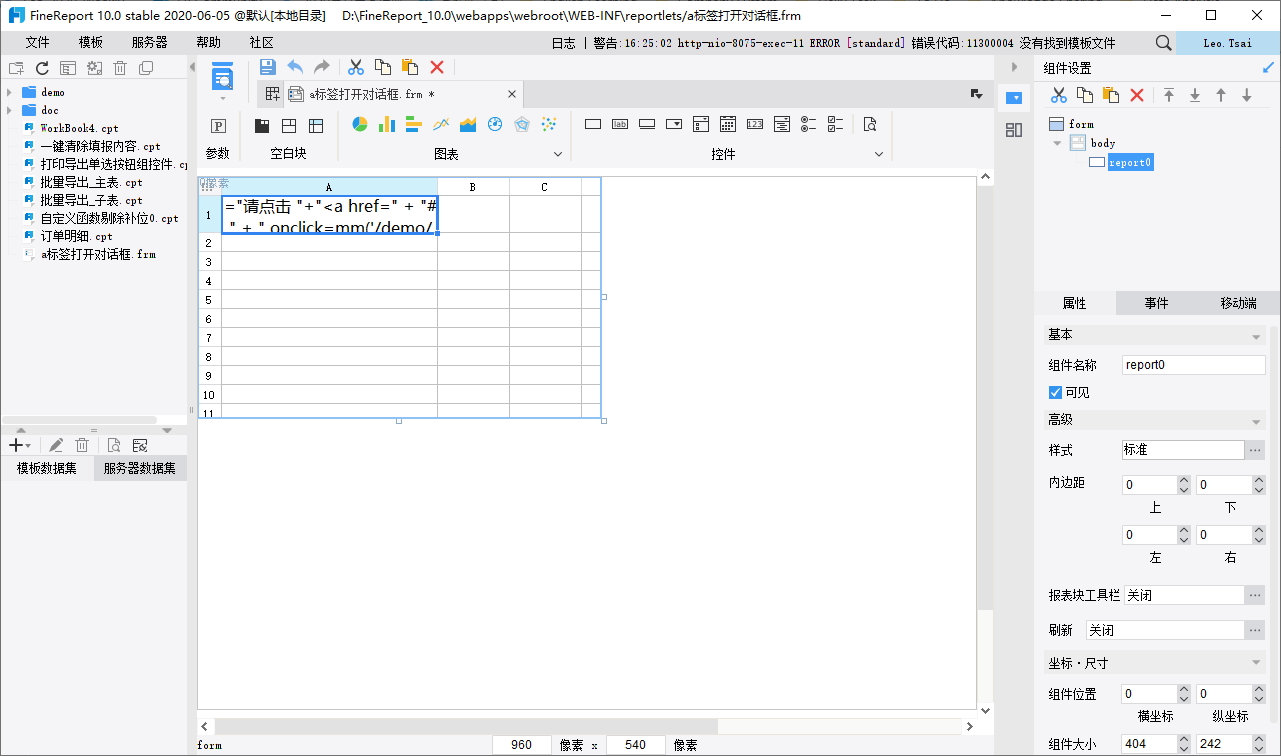
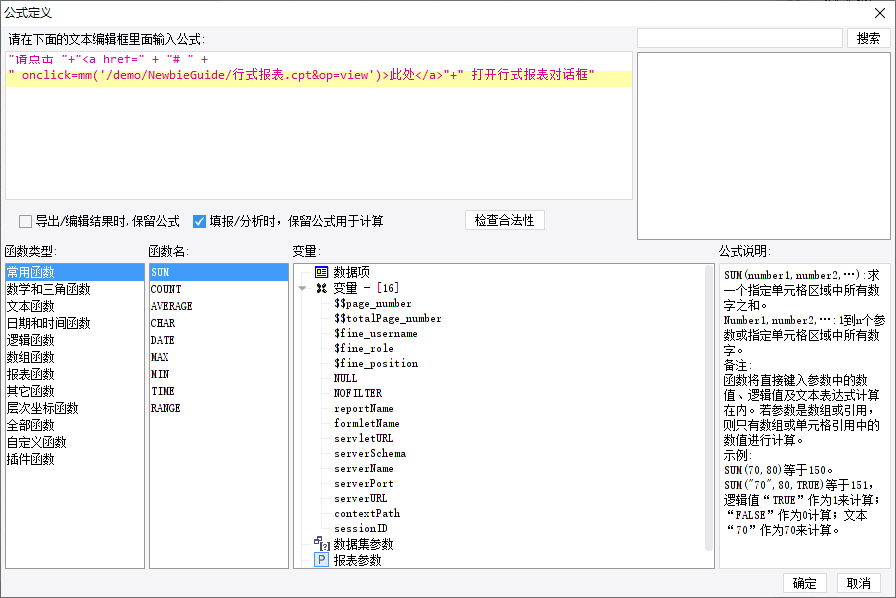
2.2 БЈБэПщЩшМЦ
1ЃЉБрМБЈБэПщ report0ЃЌA1 ЕЅдЊИёВхШыЙЋЪНЃК"ЧыЕуЛї "+"<a href=" + "# " + " onclick=mm('/demo/NewbieGuide/ааЪНБЈБэ.cpt&op=view')>ДЫДІ</a>"+" ДђПЊааЪНБЈБэЖдЛАПђ"
зЂЃКдк mm('') РяУцЬэМгашвЊДђПЊЕФБЈБэТЗОЖЕижЗЃЌДЫДІвдДђПЊФкжУЕФааЪНБЈБэЮЊР§ЁЃ
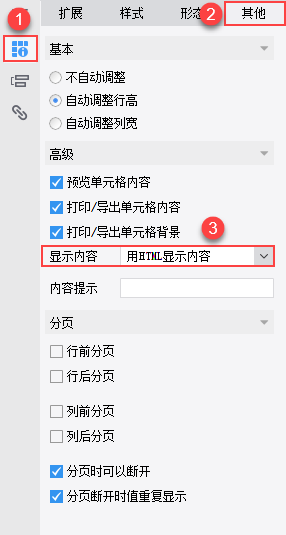
2ЃЉЙЋЪНЬэМгЭъГЩКѓЃЌНЋ A1 ЕЅдЊИёЯдЪОФкШнЩшжУЮЊЃКгУHTMLЯдЪОФкШнЃЌШчЯТЭМЫљЪОЃК
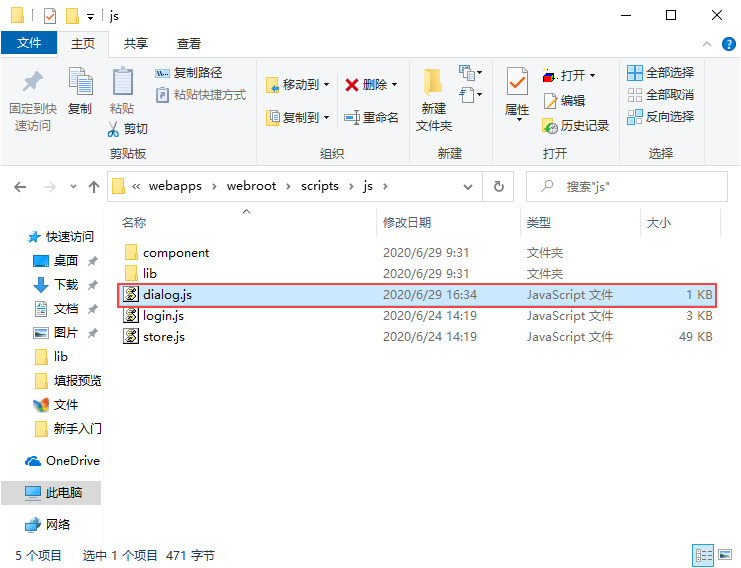
2.3 в§гУ JavaScript
1ЃЉЕуЛїЯТди JavaScript ЮФМўЃКdialog.js ЃЌНЋИУЮФМўЗХЕН%FR_HOME%\webapps\webroot\scripts\jsФПТМЯТЃЌШчЯТЭМЫљЪОЃК
JavaScript ДњТыШчЯТЃК
function mm(k){
var height=document.body.clientHeight;
var width=document.body.clientWidth;
var iframe = $("<iframe id='inp' name='inp' width='100%' height='100%' scrolling='yes' frameborder='0'>");
iframe.attr("src","form?viewlet="+k);//ЛёШЁaБъЧЉТЗОЖ
//iframe.attr("src", "form?viewlet=Form7.frm");
var o = {
width : width*1, //ЖдЛАПђПэЖШ
height: height*1 //ЖдЛАПђИпЖШ
};
FR.showDialog("", o.width, o.height, iframe,o);//ЕЏГіЖдЛАПђ
}
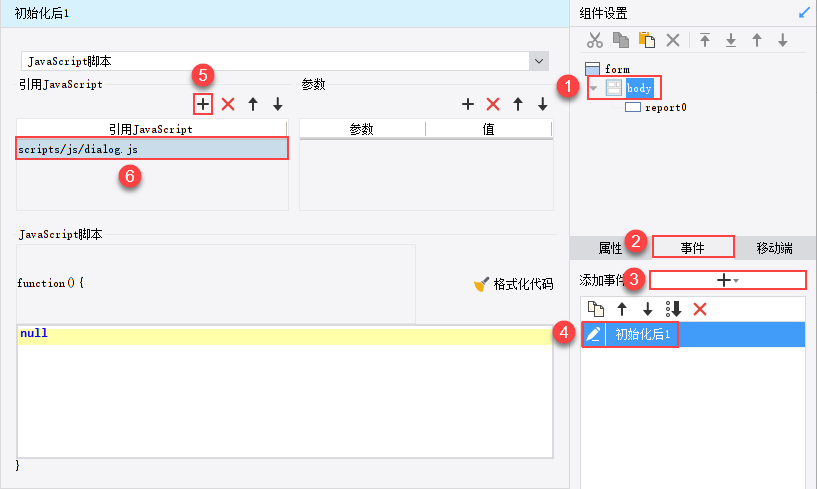
2ЃЉбЁжа bodyЃЌЬэМгвЛИіГѕЪМЛЏЪТМўЃЌв§гУЩЯЪі JavaScript НХБОЃЌШчЯТЭМЫљЪОЃК
2.4 аЇЙћдЄРР
БЃДцБЈБэЕуЛїPCЖЫдЄРРЃЌаЇЙћШчЕквЛНкЫљЪО
зЂЃКВЛжЇГжвЦЖЏЖЫЁЃ
 ЕЅдЊИёв§гУaБъЧЉДђПЊЖдЛАПђ.zip (7.2 K)